Web Report Card
Media Companies and their Websites: Maybe Yours Isn't That Comparably Bad
Posted by Charlie Recksieck
on 2023-06-08
One of the main reasons we do this is to give context to these ratings - and to perhaps make you feel a little better about the state of your own web site. Of course, we like to advise and encourage everyone to make their site as good as possible with concrete design (and structural, platform) guidance. But when we're showing you analytic tools that might give you a C-minus in one area, we don't want you to get too discouraged.
On these group web ratings we do, it's educational to see that where you might have a D-plus about your page-loading speed, some giant Dow Jones corporation might be doing just as poorly on their website.
Plus, it's a reminder that great web design is not easy. It just isn't; even for some giant companies with huge development teams.
This Week's Group - Media Companies
In the past we've looked at top retailers and the 10 top Fortune 500 companies to evaluate their websites.
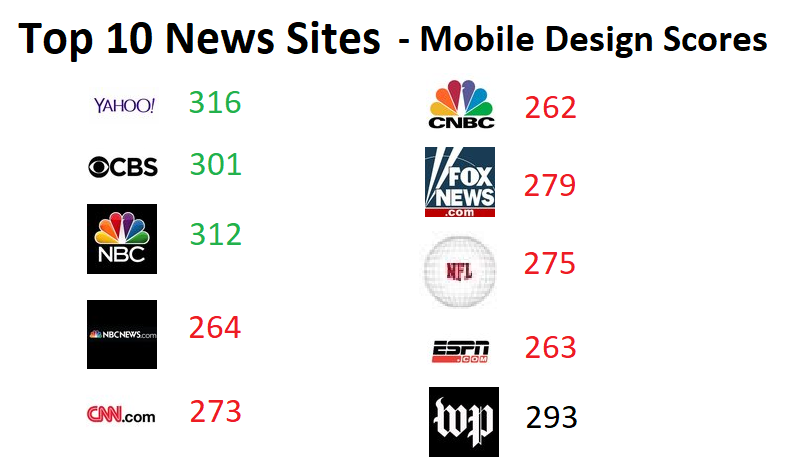
For this week's group report card, we're looking at the Top 10 news websites.
This list itself from yougov.comis interesting for just what they consider news/media companies and who cracks their top 10. For starters, both the NY Times and Buzzfeed are outside the first ten in their ratings (a homegrown algorithm of usage and positive public opinion) and trail US Weekly and the NFL.
The Evaluation
Simple. We're just running these sites through https://pagespeed.web.dev/. You're free to try them on your own site or any site that you choose.
1. Yahoo
Speed: 45 Accessibility: 96 Best Practices: 75 SEO: 99 TOTAL: 316
2. CBS.com
Speed: 44 Accessibility: 96 Best Practices: 75 SEO: 86 TOTAL: 301
3. NBC.com
Speed: 34 Accessibility: 96 Best Practices: 83 SEO: 99 TOTAL: 312
4. NBCNews.com
Speed: 38 Accessibility: 75 Best Practices: 75 SEO: 76 TOTAL: 264
5. CNN.com
Speed: 25 Accessibility: 96 Best Practices: 67 SEO: 85 TOTAL: 273
6. CNBC
Speed: 38 Accessibility: 81 Best Practices: 67 SEO: 76 TOTAL: 262
7. FoxNews.com
Speed: 31 Accessibility: 90 Best Practices: 67 SEO: 91 TOTAL: 279
8. NFL.com
Speed: 27 Accessibility: 74 Best Practices: 83 SEO: 91 TOTAL: 275
9. ESPN.com
Speed: 25 Accessibility: 79 Best Practices: 75 SEO: 84 TOTAL: 263
10. washingtonpost.com
Speed: 33 Accessibility: 88 Best Practices: 75 SEO: 97 TOTAL: 293
Brief Analysis
Speed - These are some atrocious numbers. Yet they shouldn't be surprising given that we are talking about media websites with an awful lot of embedded video on their home pages. The time for pages to load can vary incredibly for 3G vs. state of the art broadband. Media companies tend to operate a little bit in a bubble and have a little bit of who-cares attitude for users with slower internet.
Accessibility - These are really "readability" suggestions, like color choices, unique names, etc. They are a little harder for a report card like this to codify, but they do a decent job. While these issues are a little subjective, the NFL site gets poor marks which is pretty much reflected when you look at the site (screenshot here):

Best Practices - This is where free online report cards tend to get pickier. Their business is to report EVERYTHING that could be fixed even if they don't negatively impact readers in most situations. That said, this is really illustrative about how difficult great design is - and web maintenance. For example, FoxNews' low-ish rating of 67 is largely because they're using outdated APIs and some basic console errors and Chrome issues that are easily detected. In short, their development team has taken some shortcuts and I can guarantee that they have more people working on their website than you and I combined have.
SEO - This score does mean these pages have a high ranking on Google search results (which they do; major media outlets are definitely known in the zeitgeist, so they automatically do well in Google search; these aren't plucky little web startups.) These are just about HTML best practices for SEO. The basics of meta tags, sitemaps and image alt tags are pretty easy to get right. If you run diagnostics and get a score of 65 or below on SEO and can't figure out why - PLEASE contact a software company like us or an individual designer to help you stop those kind of unforced errors.
Overall - The quality of these sites mobile optimization seems to be based mainly on the quality of their design and their online team. We can't simply say that the sites that are more video-based are getting the lowest optimization scores.
What Does This Mean For You?
Again, we urge your sites to be as good as possible. We do urge you to run this very same report card app - https://pagespeed.web.dev - to check your results; and look at these media company scores for comparison.
The speed (page-loading) scores are the harshest. But they are really important. When somebody comes to a site or your site, if it doesn't load quickly you're very likely to lose first-time visitors. That's a critical problem. Test this out by going to your site on your phone while not connected to Wifi and see how it feels. If it seems like it's loading slowly, then do something about it.

